


How do you prioritize resilience investment?

The short answer
Prioritize resilience investment by placing each critical service or disruption scenario on two axes: business impact and current preparedness. High impact with low preparedness gets funded first. Present each gap to leadership as a business consequence, with the cost of closing it and the consequence of leaving it open.
Spraying and praying
If your tech and cyber resilience work doesn't reduce complexity, you're still spraying and praying. Every application gets a recovery plan, every supplier gets a questionnaire, every scenario gets a page. The effort is spread so thin that nothing gets strong.
There are too many applications, platforms and dependencies, and not enough hands or budget to prepare for every disruption equally. You have to choose, and leadership has to stand behind the choice.
Put impact and preparedness in one picture
We developed the impact-preparedness matrix to make that choice visible. It places each critical service or disruption scenario on two axes: what a disruption would mean for the business, and how prepared you are to deal with it.
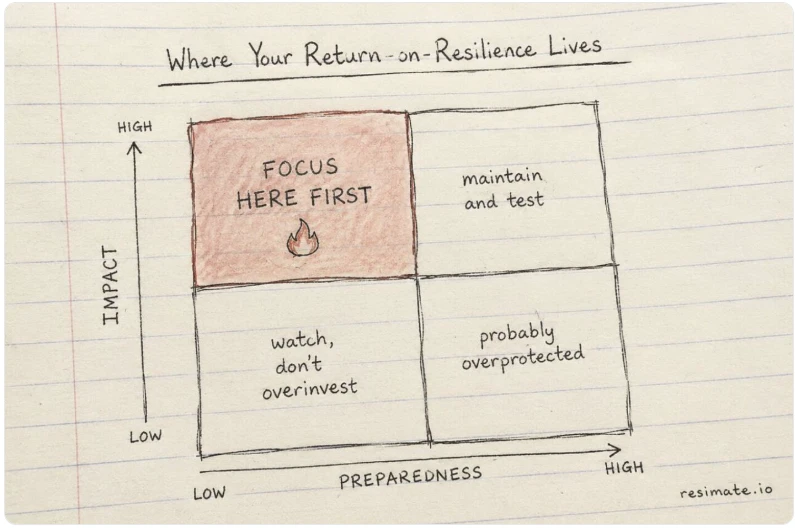
The top-left box is your investment list. The bottom-right box is where budget hides.
Measure preparedness from evidence
Impact is the easier axis. Preparedness is where organizations fool themselves, because documents claim more capability than exists. Score preparedness from evidence, which comes from three places:
- Exercises under realistic pressure, including the decision-makers.
- Real incidents and near misses, and how recovery went.
- How current the picture is. A dependency map from last year can't support a confident score.
RTO checks are a good input. A service whose recovery chain can't meet its target lands lower on the preparedness axis, whatever its plan says.
Turn risk appetite into budget
With the matrix on the table, leadership and the teams doing the work can look at the same box and decide what to do about it. Do we concentrate resources on strong, tested recovery for a smaller set of high-impact disruptions? Do we establish a solid baseline across a broader set? What are we prepared to leave less covered?
That is risk appetite translated into budget and engineering capacity. The decision belongs to leadership. Your job is to make it explicit.
Show what leaving a gap open means
Boards respond to business consequences. "The identity platform has no tested failover" gets a nod. "If the identity platform fails, online banking, card payments and the customer API stop, and our tested recovery takes 4 hours longer than our tolerance" gets a decision.
For each gap, show three things: the business consequence, the cost of closing it, and what the improvement buys. If we cut that dependency's recovery time from eight hours to four, does the minimum service come back before the business workarounds run out? That is the test.
Give every gap an owner
A prioritized list without owners stays a list. Give each gap in the top-left box an owner and a date. If leadership decides to accept a gap, record the decision and a review date. Your teams get what they need: a clear focus and leadership's backing to prioritize the work.
A practical way to begin
- List your critical services or your top disruption scenarios.
- Score the business impact of each, using the impact dimensions leadership already uses.
- Score preparedness from evidence: exercises, incidents and how current your data is.
- Place them in the matrix and pick the top three gaps in the high-impact, low-preparedness box.
- For each, write the business consequence, the cost of closing it and an owner, and take it to leadership.
How we do this in resimate
The Impact-Preparedness Matrix in resimate shows where impact is high and readiness is low. Mismatches between recovery objectives and service levels along the dependency chain are visible, and every capability improvement gets recorded with an owner. That gives you an investment list in business terms, ready for the board. Teams go live in 4 to 6 weeks, on the data they already have.